A customer exits Fischer Hardware in Beaver, Pa., Tuesday, May 12, 2020. Beaver County Commissioners have said they disagree with Pennsylvania Governor Tom Wolf and the county will act as if they are transitioning to the "yellow" phase on May 15. Pennsylvania Governor Tom Wolf announced, May 8, that 13 southwestern Pennsylvania counties, not including Beaver County, that would remain in the "red" phase where the stay-at-home order is still in effect, would move to the "yellow" phase on May 15.
Combining different models, new coronavirus projection shows 110,000 deaths by June 6
But, biostatisticianome cautions some of the models are gyrating fairly significantly from week to week.
By Nurith Aizenman and Sean McMinn/NPR
Gene J. Puskar / AP Photo
A customer exits Fischer Hardware in Beaver, Pa., Tuesday, May 12, 2020. Beaver County Commissioners have said they disagree with Pennsylvania Governor Tom Wolf and the county will act as if they are transitioning to the "yellow" phase on May 15. Pennsylvania Governor Tom Wolf announced, May 8, that 13 southwestern Pennsylvania counties, not including Beaver County, that would remain in the "red" phase where the stay-at-home order is still in effect, would move to the "yellow" phase on May 15.
With our coronavirus coverage, our goal is to equip you with the information you need. Rather than chase every update, we’ll try to keep things in context and focus on helping you make decisions. See all of our stories here.
(Washington) — More than 82,000 people in the U.S. have died of COVID-19 as of Tuesday. How many more lives will be lost? Scientists have built dozens of computational models to answer that question. But the profusion of forecasts poses a challenge: The models use such a wide range of methodologies, formats, and time frames, it’s hard to get even a ballpark sense of what the future has in store.
Enter Nicholas Reich, a biostatistician at University of Massachusetts Amherst. Reich and his colleagues have developed a method to compare and ultimately to merge the diverse models of the disease’s progression into one “ensemble” projection. The resulting forecast is sobering: By June 6, the cumulative death toll in the U.S. will reach 110,000.
Reich’s approach builds on work he’s done over the past four years for the Centers for Disease Control and Prevention, pulling together the many forecasts that U.S. experts create annually to predict how that year’s seasonal influenza will play out.
Reich’s team has set up asimilar system to compare coronavirus models. It’s a sort of portal through which the scientists behind each COVID-19 model can communicate key details about their methodology and results, so that, as Reich explains, “all of these forecasts can be represented in a single standardized way. And this makes it really easy to make apples-to-apples comparisons between these models.”
The team unveiled the first version four weeks ago, and ever since they’ve been adding in more forecasts and updating the projections on a weekly basis. The latest update — released Tuesday — incorporates eight models, including some oft-cited ones, such as those built by the Imperial College London, the University of Washington Institute for Health Metrics and Evaluation, Columbia University, and Northeastern University. (They also send each week’s release to the CDC, which publishes a version with a slight time lag.)
The projections vary substantially — with the most pessimistic forecasting a total death toll of 120,000 by June 6, and the most optimistic forecasting 103,000 deaths by that date. But the models have been inching closer to each other. Over the last several weeks, the distance between the highest and lowest estimates has halved from a gap of 36,000 deaths two weeks ago, to a gap of 17,000 deaths in the most recent update released Tuesday.
Still, says Reich, that remains a large difference. Also, he says, some of the models are gyrating fairly significantly from week to week.
“The most pessimistic model a few weeks ago was the model from Los Alamos National Laboratory,” notes Reich. “Now Los Alamos is one of the most optimistic.” Meanwhile the models produced by IHME and University of Texas at Austin respectively have substantially increased their projected deaths tolls — becoming among the most pessimistic.
There are a range of reasons for these changes: The scientists are getting new data; they are updating their methods as they calibrate their models against the reality to date; and lastly, Americans have stopped social distancing to the same degree as they had been in March and April — requiring models that assumed a longer stay-at-home period to adjust their forecasts upward.
But how do we make sense of these COVID-19 projections if the models can see-saw so abruptly from week-to-week? That’s where Reich’s “ensemble” model may be helpful. It’s a strategy that forecasters use regularly to model not just disease outbreaks, but other phenomena ranging from weather to electoral outcomes.
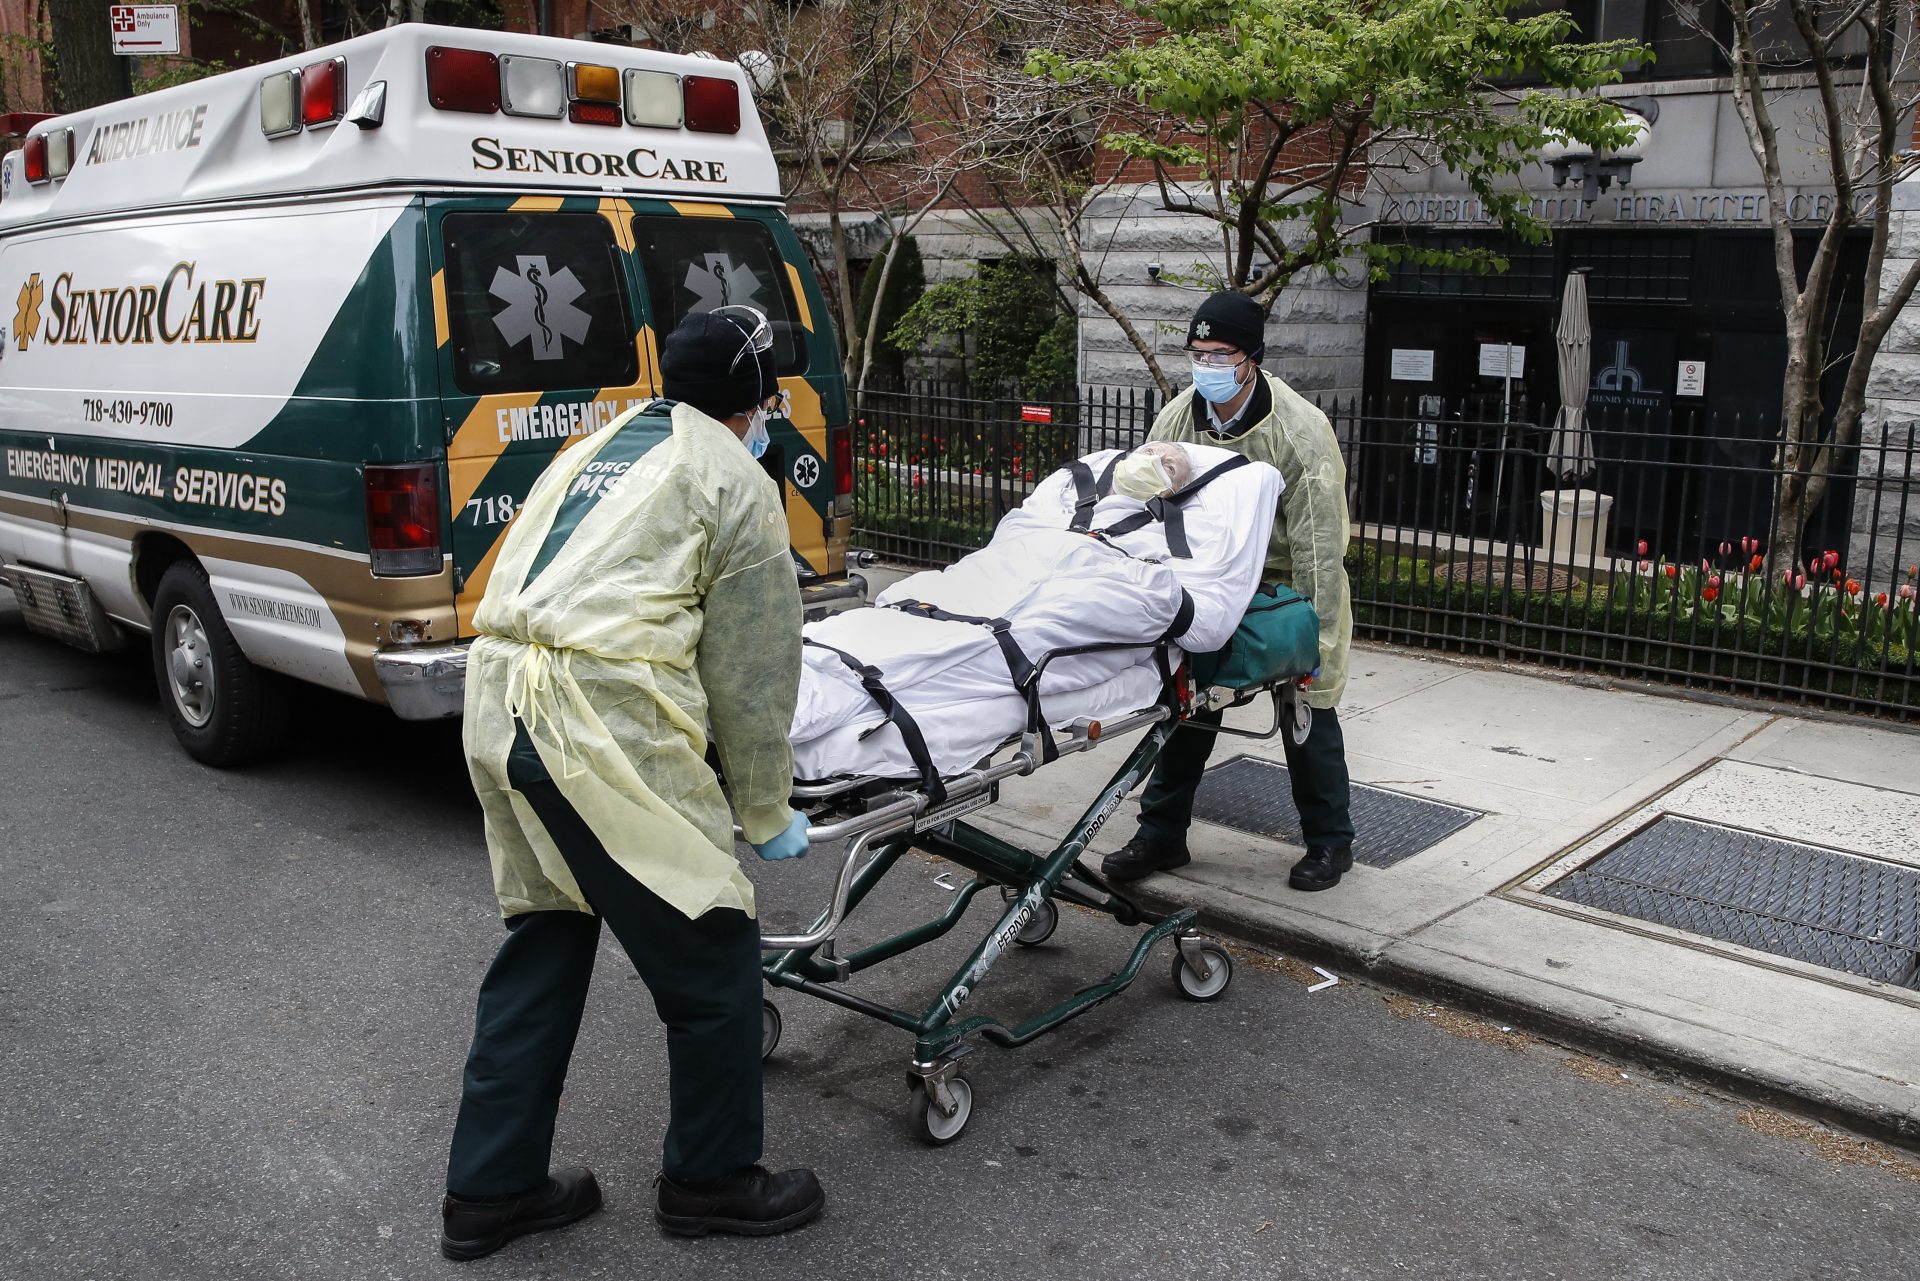
John Minchillo / AP Photo
A patient is loaded into the back of an ambulance by emergency medical workers outside Cobble Hill Health Center, Friday, April 17, 2020, in the Brooklyn borough of New York. The despair wrought on nursing homes by the coronavirus was laid bare Friday in a state survey identifying numerous New York facilities where multiple patients have died. Nineteen of the state’s nursing homes have each had at least 20 deaths linked to the pandemic. Cobble Hill Health Center was listed as having 55 deaths. (AP Photo/John Minchillo)
“Individual models are being changed every week. They’re sensitive to the last observed data in different ways,” says Reich. But with an ensemble “there’s a certain consistency and robustness. You’re not quite, sort of flapping in the wind.”
Caitlin Rivers, an epidemiologist at Johns Hopkins Center for Health Security agrees. “We know from the experience of seasonal influenza that ensemble models tend to perform better than any single model,” she says.
And the approach is particularly well-suited in this pandemic given how much is still unknown. “This ensemble approach really pulls together those different results and makes them, in some ways, greater than the sum of their parts,” says Rivers.
Reich thinks he can still improve his ensemble model. For instance, at the moment Reich is giving equal weight to each of the forecasts that go into it. But soon he hopes to give more weight to those that are proving more accurate — an approach that he uses in his ensemble models for flu.
“Model accuracy is one thing that we’re tracking and we’re hoping to release some information on over the next few weeks,” says Reich. “We’ve been sort of building the car as we’re driving it at 90 miles an hour down the highway. And we’re learning as we go.”
In the meantime, says Rivers, it is at least useful to be able to see the range of forecasts that have been produced. “It tends to help the user to understand where the uncertainties are and the spectrum of possible futures,” she says.
That said, Reich’s setup only compares projections through the next four weeks — since many of the models don’t offer forecasts beyond that point. This is why the latest update his team released projects deaths up to June 6.
Still, in that first week of June about 7,000 people are projected to die. The clear implication, adds Reich: The cumulative death toll of 110,000 forecast through June 6 will unquestionably rise much higher in the weeks beyond.
Sometimes, your mornings are just too busy to catch the news beyond a headline or two. Don’t worry. The Morning Agenda has got your back. Each weekday morning, host Tim Lambert will keep you informed, amused, enlightened and up-to-date on what’s happening in central Pennsylvania and the rest of this great commonwealth.