How do polls account for undecided voters in Pa.’s U.S. Senate Race?
-
Robby Brod
With the midterm elections two months away, people will be watching polls in key races — but they often show very different results. Here’s an explainer to help you assess the differences:
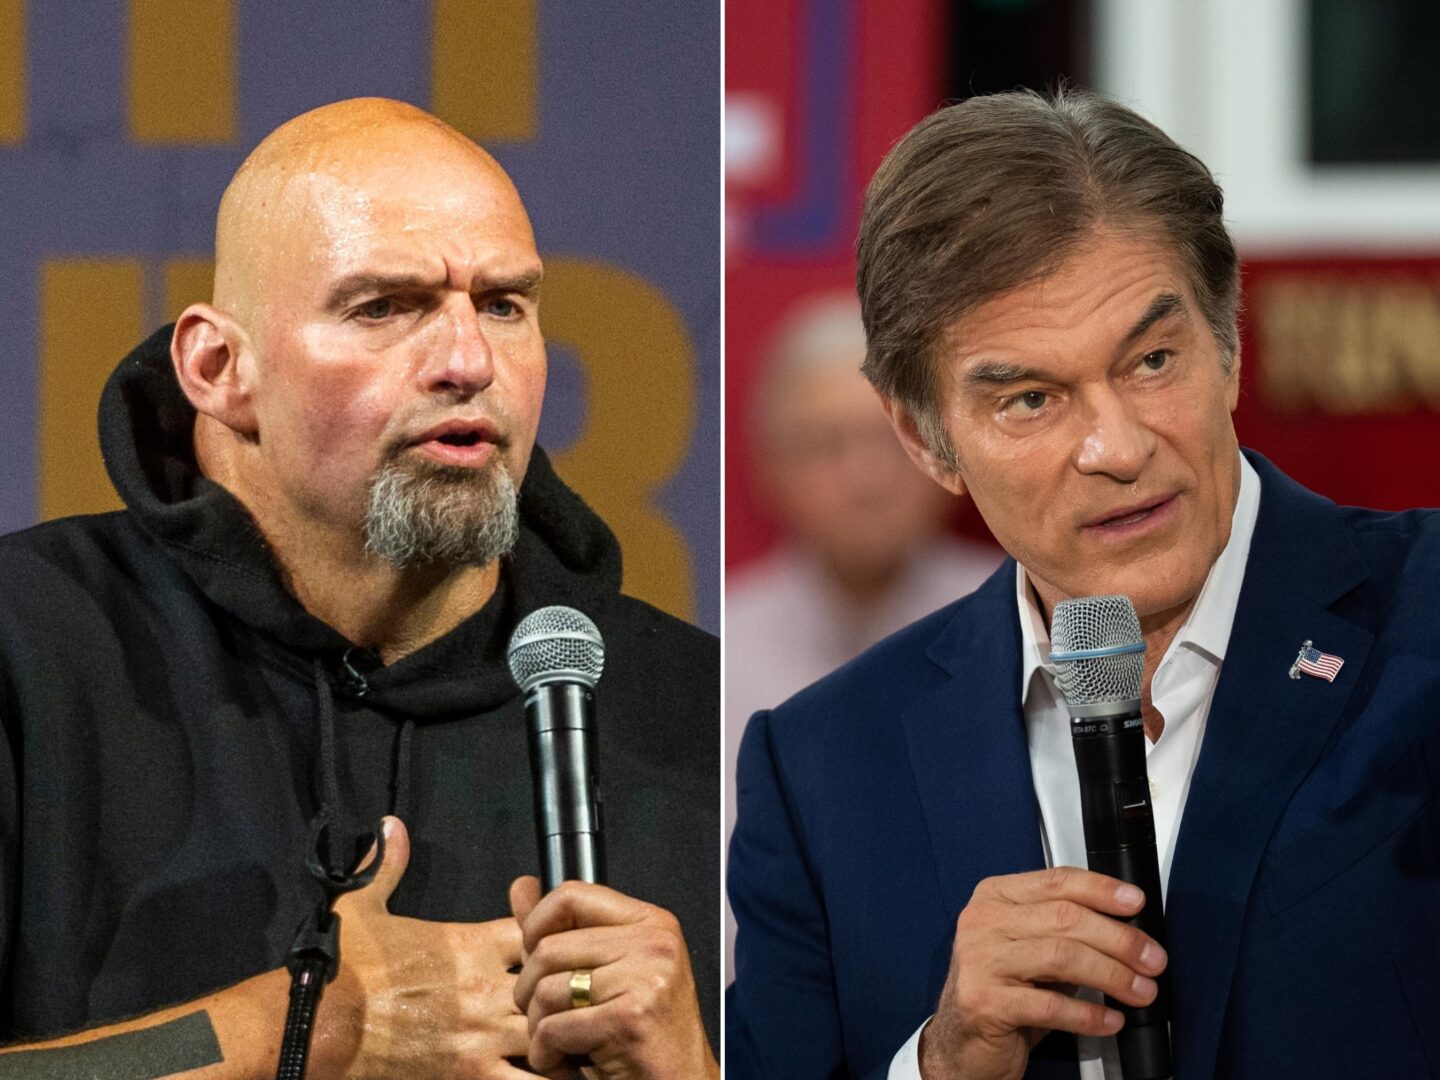
The most recent polling data about Pennsylvania’s U.S. Senate race from both Harrisburg-based Susquehanna Polling and Research and Emerson College in Boston show Democrat John Fetterman leading Republican Mehmet Oz by 4-5 percentage points, with a 3-3.7% margin of error.
Franklin & Marshall’s poll, however, shows a 13% lead for Fetterman, well outside its 5.3% margin of error.
So why the stark differences?
Pollsters from each group said one of the main reasons is the way they handled undecided voters, which can affect poll results.
Berwood Yost, director of Franklin & Marshall’s Center for Opinion Research, included third party candidates and “aren’t you sure how you would vote” as a response in their poll about the Senate race.
He says F&M’s poll initially showed 20% of voters were undecided.
“If we take another step and we ask those undecided voters if they lean towards one candidate or another, about half of them took us up on that offer,” he said. “And so, the true number of undecideds is probably closer to 10%.”
Yost said encouraging voters to say they didn’t know who to vote for and further questioning of undecided voters contributed to a double-digit lead for Fetterman.
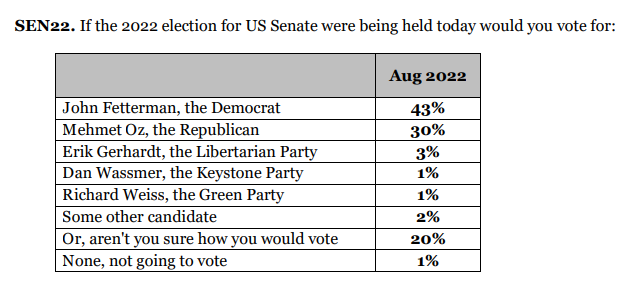
Franklin & Marshall College Poll: August 2022
Jim Lee, who owns and operates Susquehanna Polling and Research, instructed his pollsters to not include “undecided” as a choice.
“We think it skews the results in an erroneous way,” he said. “But it’s an option. If a voter responds that they’re undecided, we say, ‘Okay, no problem, we’ll mark as ‘undecided,’ and we think we get more accurate results that way.”
He also said his firm simply doesn’t have the resources to more thoroughly poll undecided voters, so he cross-references other data sets to learn more about them.
“We ask voters, what’s the top issue you want that will influence your vote for Congress? Is it abortion, is it the economy? Inflation? So, we’re looking to try to make some sense of what’s motivating them,” he said.
Susquehanna Polling and Research’s Pennsylvania Statewide Telephone Poll Conducted August 20-28, 2022
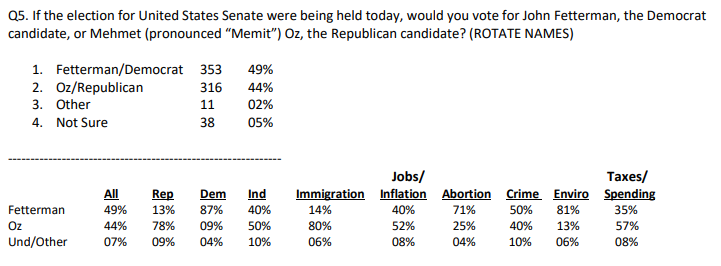
Spencer Kimball, founding director of Emerson’s Polling Center, included undecideds in his most recent poll. But in October, he’ll begin to force them to make a choice, inspired by longtime political pollster Warren Mitofsky — famed for creating the exit poll and running CBS News’ election and survey unit for over 20 years.
“He suggested that for the public to consume [polls], you should take out the undecided vote and that allows the public to better understand what’s happening. And so in 2018, that’s what we tested,” Kimball said.
During their final polls of the 2018 midterms, Emerson tested out Mitosfky’s theory and forced their undecided voters to choose a candidate.
They published their findings in a study that found in the last round of polls, there was “no significant difference” in accuracy depending on what they did with undecideds.
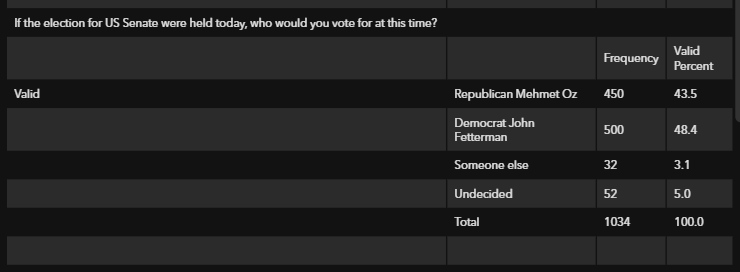
Emerson College’s Pennsylvania General Election Poll (August 2022)
Different methodologies affect tallies of undecideds
All three polls used different modes of questioning their participants, which they each say affected the number of undecided voters.
Susquehanna’s was conducted entirely with live telephone agents; Emerson used a mix of online responses and automated calls using interactive voice response (IVR); and F&M used both online surveys and live phone interviews.
According to The Pew Research Center, respondents react differently to web polls than those over the phone.
They found net favorability ratings in political polls were significantly higher with phone respondents than with those on the web. Web respondents were significantly more likely to choose more negative responses. They also found that when interviewers are present, respondents tend to choose answers “less likely to produce an uncomfortable interaction with the interviewer.”
Yost said his research tells him that people are more likely to say they don’t know how to feel about a candidate when speaking over the phone.
“But it also depends on how you ask the question,” he said. “Do you encourage people to say they don’t know, or do you encourage them to make a choice? Because if you do that, people will pick.”
Jim Lee said that ending Susquehanna’s over-the-phone poll questions with “I don’t know” or “undecided” would make more people choose those options, leading him to nix the question.
“And then the percent of voters committed to either major candidate always tends to be underreported,” he said. “In terms of polling methodology, about question wording, that all matters in my opinion.”
Emerson College used a mixed-mode approach, partially, for budgetary reasons.
“The difference between doing a live operator and the mixed mode approach using what we’re doing is roughly about 20% the cost,” Kimball said. “So, a $100,000 poll for them costs us $20,000. We can do five more polls than what the other group can do.”
Kimball said mixing modes affects his number of undecideds, but he uses guidance from polling firm Public Policy Polling to try to ensure the numbers are accurate.
“We’re learning that there is a difference in the raw data between live operator and mixed mode data collection, but the [PPP’s] weighting system has been provided based on prior elections,” he said. “And then the weighting that the pollsters employ can obviously have an impact on what those numbers look like.”
While accuracy is the goal of his poll, Kimball encourages readers to view his numbers as a piece of a larger puzzle.
“Surveys and polls need to be read with a margin of error and they should be read as a trend. So if you see all the polls lining up four, five, eight, 13 points in one direction, I’m telling you the polls are leaning there,” he said. “But remember, a poll is not an exact score, it’s supposed to be read as a range of scores. “
Yost said F&M’s aim is to create an authentic simulation of what the ballot looks like on Election Day.
“I want to make sure I make it clear; I don’t think there’s one right way to do this,” he said. “At the end of the day, you could suggest that most people will choose between one of the two major party candidates, so you could focus on that and force them to make a choice. And that makes sense. But you could also do what we do, which is we provide a listing of all the candidates that will be on the ballot and also encourage them to say, ‘don’t know.’”
Yost urged those looking at poll numbers to be careful not to make broad assumptions — especially about undecideds.
Related Stories
Sometimes, your mornings are just too busy to catch the news beyond a headline or two. Don’t worry. The Morning Agenda has got your back. Each weekday morning, host Tim Lambert will keep you informed, amused, enlightened and up-to-date on what’s happening in central Pennsylvania and the rest of this great commonwealth.