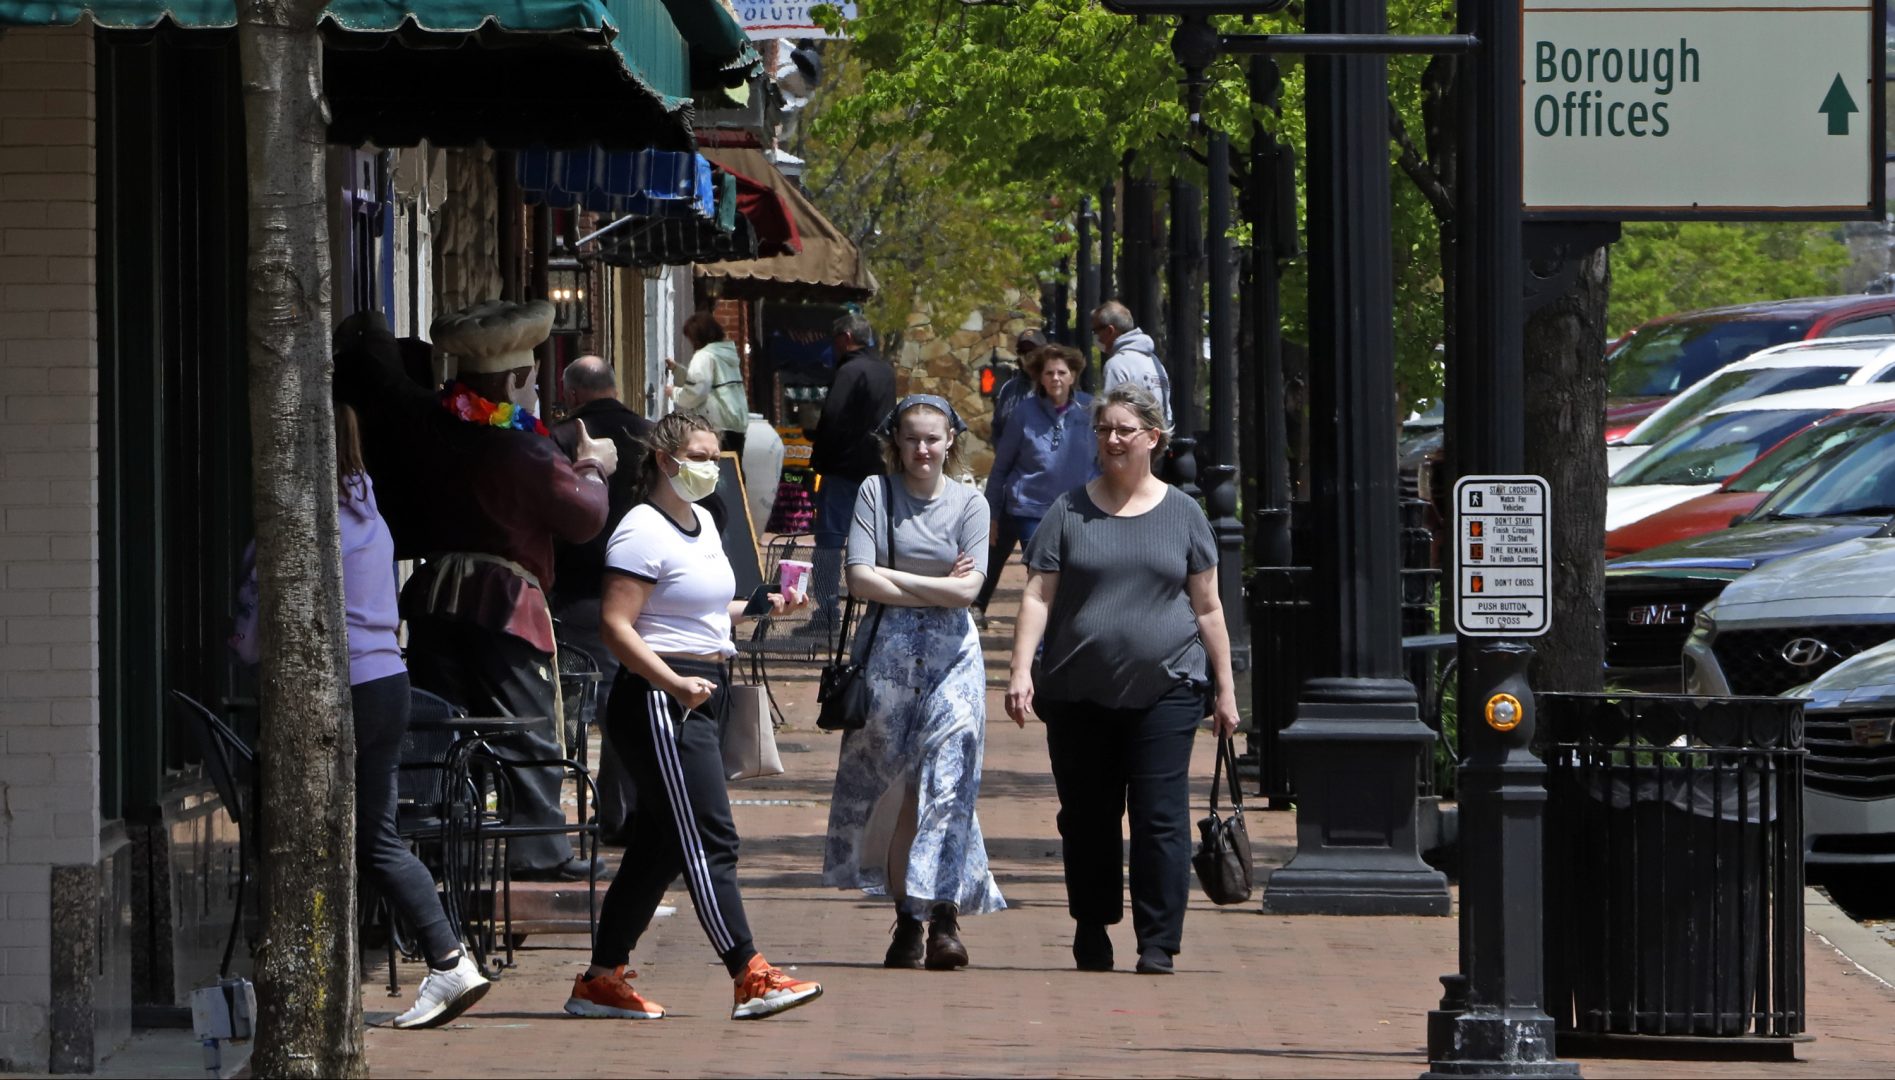
In this May 12, 2020, photo, people gather outside shops in Beaver, Pa. Pennsylvania Gov. Tom Wolf is struggling to fight against a Republican revolt over his stay-at-home orders and business shutdowns. Egged on by state GOP lawmakers, counties have threatened to defy his orders while at least a few business owners have reopened their doors despite his warnings.
NPR delivers breaking national and world news. Also top stories from business, politics, health, science, technology, music, arts and culture. Subscribe to podcasts and RSS feeds.
Gene J. Puskar / AP Photo
In this May 12, 2020, photo, people gather outside shops in Beaver, Pa. Pennsylvania Gov. Tom Wolf is struggling to fight against a Republican revolt over his stay-at-home orders and business shutdowns. Egged on by state GOP lawmakers, counties have threatened to defy his orders while at least a few business owners have reopened their doors despite his warnings.
(Washington) — More than 2 million people in the U.S. have tested positive for the coronavirus and more than 115,000 have died. The growth in new cases overall had slowed in late spring but new hot spots began to emerge as others subsided. By mid-June new cases began to trend upward nationally as several states saw surges.
Loading…
In the graphics below, explore the trend in new cases in your state to see whether cases are rising, falling or staying level. To jump to a map of total cases and deaths by state, click here.
Loading…
The following chart displays states’ trends in new daily case counts, total cases, and per capita totals. To compare state outbreaks, the trend lines for average new daily cases are graphed against each state’s total case count to date. This highlights a state’s daily growth relative to the overall size of its outbreak.
When both new and total case counts grow quickly, the curve bends upward. As cases slow, the curve levels or bends down. In New York, site of the country’s largest outbreak, the state’s curve rose sharply before reaching over 170,000 total cases in April. Since then, new cases have fallen from about 10,000 per day in mid-April to fewer than 700 per day in late June.
Some states, such as Hawaii, have declined to just a dozen new cases per day, while others are growing. Arizona, which had leveled off at around 15,000 total cases in May, saw a sudden sharp spike in new cases in June.
Loading…
The coronavirus has hit some states much harder than others. For much of the pandemic, a large share of U.S. cases have been centered around New York City. As of early June, New York state, Connecticut and New Jersey accounted for about 30% of total cases in the nation and 42% of deaths, although new cases have been dropping in these three states. Across the country, other large, populous states such as California, Illinois and Texas have high totals as well.
Some smaller states have had a heavy burden of disease relative to their population size, such as Nebraska and Iowa, which have high case counts per capita, and Louisiana and Michigan which have a high death count per capita.
For more detail on your state, the table below shows the change in average new cases per day in each state, week over week. States marked in shades of red are showing growth, those in shades of green, are showing declines.
Loading…
Methodology
The data used here are compiled by the Center for Systems Science and Engineering at Johns Hopkins University from several sources, including the Centers for Disease Control and Prevention; the World Health Organization; national, state and local government health departments; 1point3acres; and local media reports. The JHU team automates its data uploads and regularly checks them for anomalies. State-by-state recovery data are unavailable at this time. There may be discrepancies between what you see here and what you see on your local health department’s website. Figures shown do not include cases on cruise ships.
In early June, Michigan health authorities started including probable cases in its totals. This resulted in a brief spike in the state’s daily numbers until the JHU team was able to reconcile the historical data.
This story was originally published on March 16, 2020. Elena Renken was a co-author on that version.
Sean McMinn contributed to and Carmel Wroth edited this story.
A collection of interviews, photos, and music videos, featuring local musicians who have stopped by the WITF performance studio to share a little discussion and sound. Produced by WITF’s Joe Ulrich.