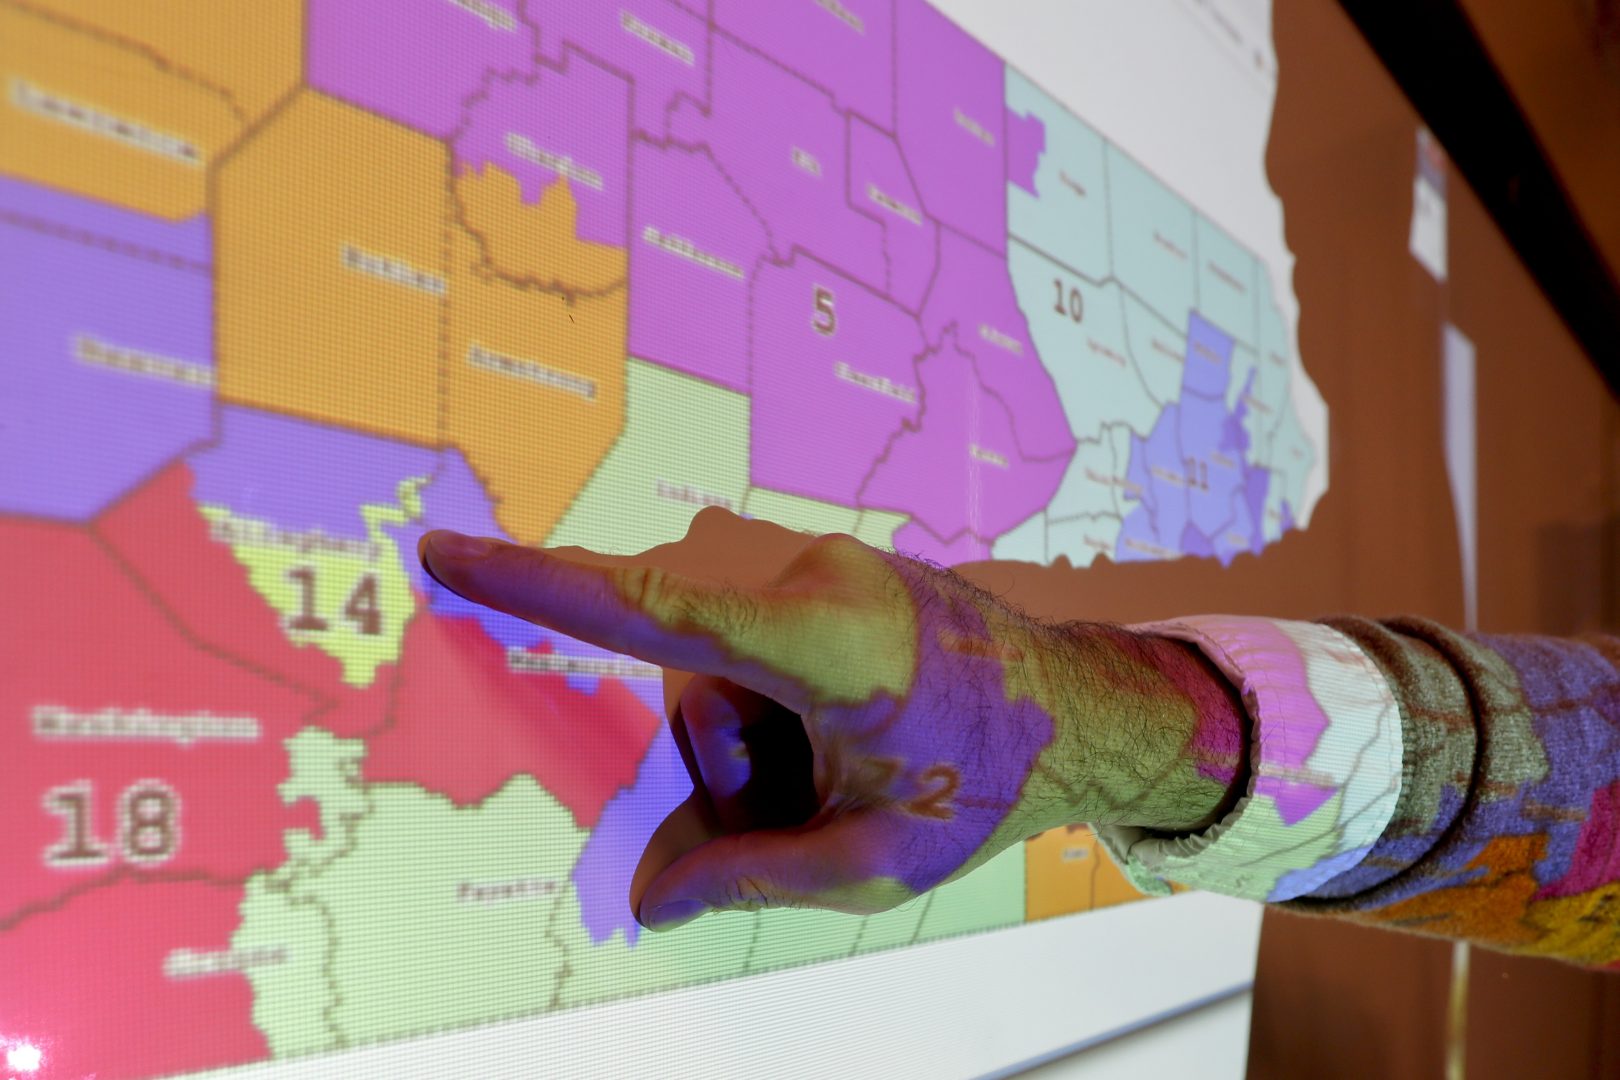
William Marx points out one of the districts that crossed four counties as an image of the old congressional districts of Pennsylvania are projected on a wall in the classroom where he teaches civics in Pittsburgh on Friday, Nov. 16, 2018. Marx was a plaintiff in the Pennsylvania lawsuit that successfully challenged the Republican-drawn congressional maps. Marx said he believes the new district boundaries resulted in "a more fair congressional representation of the will of the people in Pennsylvania."
Emily is a reporter for WITF who’s been covering voting and elections since July 2019 as part of her former role with statehouse accountability news organization PA Post. She was the senior reporter for statewide public media collaboration Keystone Crossroads. Previously, she covered city hall for PennLive/The Patriot-News (Harrisburg, Pa.), was a watchdog and city hall reporter at The Press of Atlantic City and reported for the Northwest Herald. She is a graduate of the University of Pennsylvania.
William Marx points out one of the districts that crossed four counties as an image of the old congressional districts of Pennsylvania are projected on a wall in the classroom where he teaches civics in Pittsburgh on Friday, Nov. 16, 2018. Marx was a plaintiff in the Pennsylvania lawsuit that successfully challenged the Republican-drawn congressional maps. Marx said he believes the new district boundaries resulted in "a more fair congressional representation of the will of the people in Pennsylvania."
The slider above shows 2018 election results mapped by both the new congressional map (left) and the old one (right).
(Harrisburg) — A PA Post/Keystone Crossroads analysis of 2018 midterm election results calls into question the idea that Pennsylvania’s previous congressional map was a “voter proof” gerrymander in favor of Republicans.
We analyzed certified precinct-level results from the Pa. Department of State and counted the votes that were cast within the boundaries of the previous district shapes, and found the state’s congressional delegation would have a 9-9 partisan split even if the former map had been in place in November.
That’s the same outcome yielded by the new map that was actually in effect — implemented after the state Supreme Court deemed the old one an unconstitutional partisan gerrymander.
In the three previous congressional election cycles, Republicans held a 13-5 advantage in the state’s delegation.
There are many caveats to note in this hypothetical experiment. It’s extremely unlikely that the 2018 campaign would have featured the same candidates, strategy and voter turnout had the map not changed.
But, still, some political onlookers were surprised by the findings.
“The logic was that this was going to really hamper Democrats if this old map had stayed in place for the 2018 midterms,” said Elizabethtown College political science professor Kyle Kopko. “And, clearly, overall, that’s not the case.”
Others cautioned against reading too much into the results.
Drew Crompton, chief of staff and counsel for Pennsylvania Senate President Pro-Tempore Joe Scarnati, said the exercise makes an “apples to bananas” comparison since the district changes discouraged some incumbents from seeking re-election.
“People decided not to run because of the new maps,” Crompton wrote in an email. “Candidates do matter and if some of the incumbents decided to run, then that is different than open seats.”
The interactive map above shows a hypothetical scenario where 2018 congressional voting results are overlaid on Pennsylvania’s former congressional map.
The candidate factor
It’s hard to know what would have happened if, for example, Republican incumbents Ryan Costello, Patrick Meehan, Charlie Dent and Lou Barletta had run last year.
In our hypothetical scenario keeping the old map, Barletta’s district remained Republican. The actual results using the new map split it among five districts, and all but one stayed under GOP control.
But there were more Democratic votes tallied this year within the district shapes formerly held by Costello and Dent.
The same can be said for Meehan’s old district, the so-called poster child for Pennsylvania gerrymandering which reminded some of Disney cartoon characters.
The big change to Costello’s former sixth district was the addition of the city of Reading in creating the new sixth, which Democrat Chrissy Houlahan won in November.
Pieces of old sixth also were incorporated into two other districts, one held by each party (Rep. Madeline Dean, D-4, and Rep. Dan Meuser, R-9).
Dent’s former 15th district — which flipped in our exercise — comprises much of the new 7th now held by Democrat Susan Wild. Pieces also fall into the new ninth and 10th, now held by Republicans Dan Meuser and Scott Perry, respectively.
Jess King, the Democrat who challenged incumbent U.S. Rep. Lloyd Smucker in a new district comprising Lancaster and parts of York counties, echoed Crompton in explaining why it’s “impossible to wager what results would’ve been in the old 16th versus the new 11th.”
King highlighted Reading in particular. She stopped campaigning in the city after the new map moved the city into a different district. If the map hadn’t changed, her campaign would have continued its efforts in Reading.
Ultimately, Smucker won the seat easily, but our analysis suggests the race would have been tighter had the old map remained.
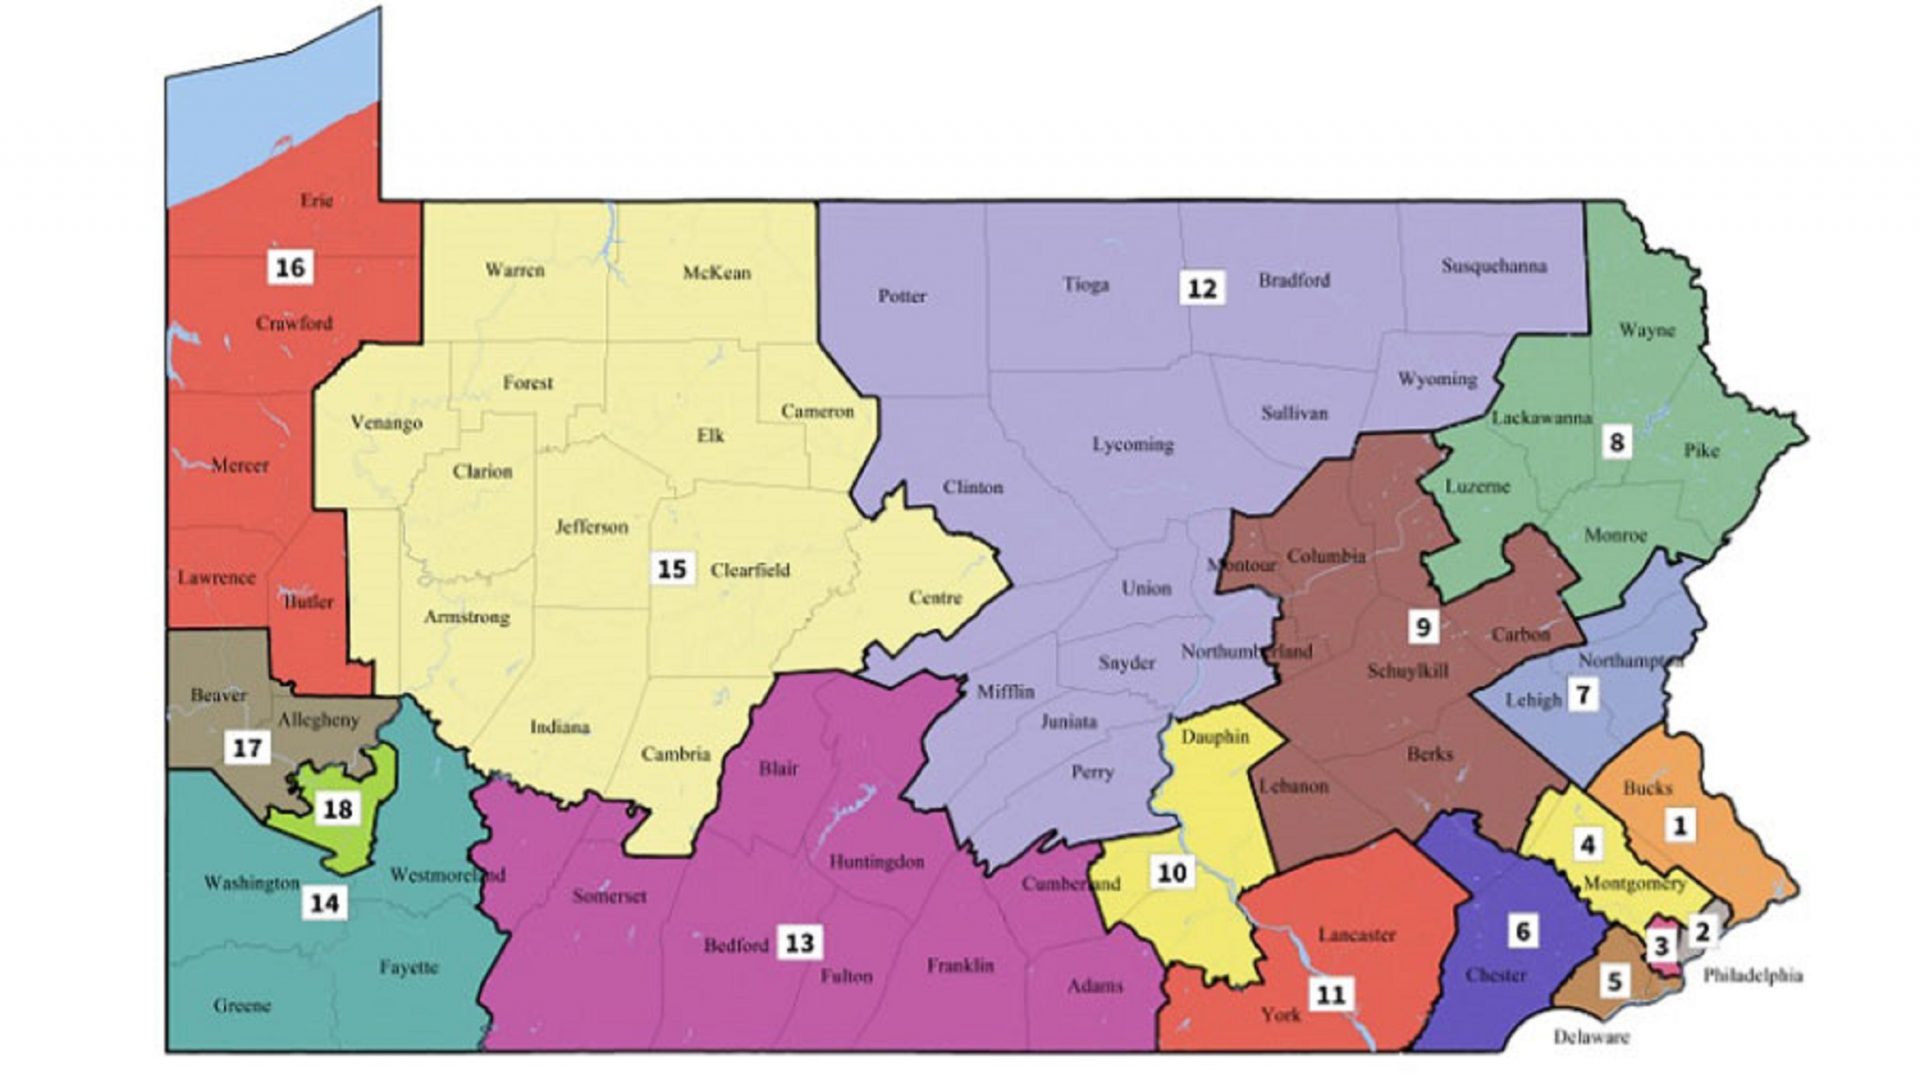
Submitted
The new Pennsylvania congressional map.
An evolving electorate
Terry Madonna, director of the Center for Politics and Public Affairs at Franklin and Marshall College, agreed candidates can, of course, make a significant difference.
Dent’s and Costello’s old districts also are in the increasingly Democratic suburbs of Philadelphia and the Lehigh Valley, Madonna said, the types of districts that came out in force across the country in the midterms in a rebuke to President Trump.
“No doubt, there was a Democratic wave,” he said.
Carol Kuniholm, co-founder of Fair Districts PA, argued that the conversation surrounding the map change itself generated voter enthusiasm.
“Lots more people came out and voted then they might have in the past … who would have otherwise just stayed home and said, ‘It doesn’t even matter. I’m not gonna bother,’” Kuniholm said.
Kuniholm also said the new map’s more compact districts allowed for more effective campaigning.
“There was a lot of door to door canvassing in ways that that would not have happened if it was the old district because it’s just not possible to do,” she said.
Turnout
Democrats took a lower share of seats relative to turnout compared to Republicans in 2018: 55 percent of ballots cast statewide and half the delegation. Republicans secured half the delegation with 45 percent of votes.
That’s a less dramatic disconnect than years past, when Republicans won 13 of 18 races with a lower share of statewide votes in three consecutive elections — less than half, in one case.
Overall, turnout levels in 2018 far exceeded past participation rates. Advocates for fairer political mapmaking note that maps are often developed with certain turnout expectations in mind.
A banner year for turnout can make year-to-year or map-to-map comparisons especially challenging.
Michael Li, senior redistricting counsel for the Brennan Center for Justice at New York University Law School, said that Pennsylvania’s previous congressional map was a Republican gerrymander that “protected for a 100-year flood.”
“[The 2018 election] turned out to be a 500-year flood,” Li said, referring to “tsunami”-like turnout. “That doesn’t mean that you couldn’t build a gerrymander for a 500-year flood. You just would have to do it differently.…And we shouldn’t depend on 500-year flood, just to bring political change.”
Sometimes, your mornings are just too busy to catch the news beyond a headline or two. Don’t worry. The Morning Agenda has got your back. Each weekday morning, host Tim Lambert will keep you informed, amused, enlightened and up-to-date on what’s happening in central Pennsylvania and the rest of this great commonwealth.